Climate Change in California

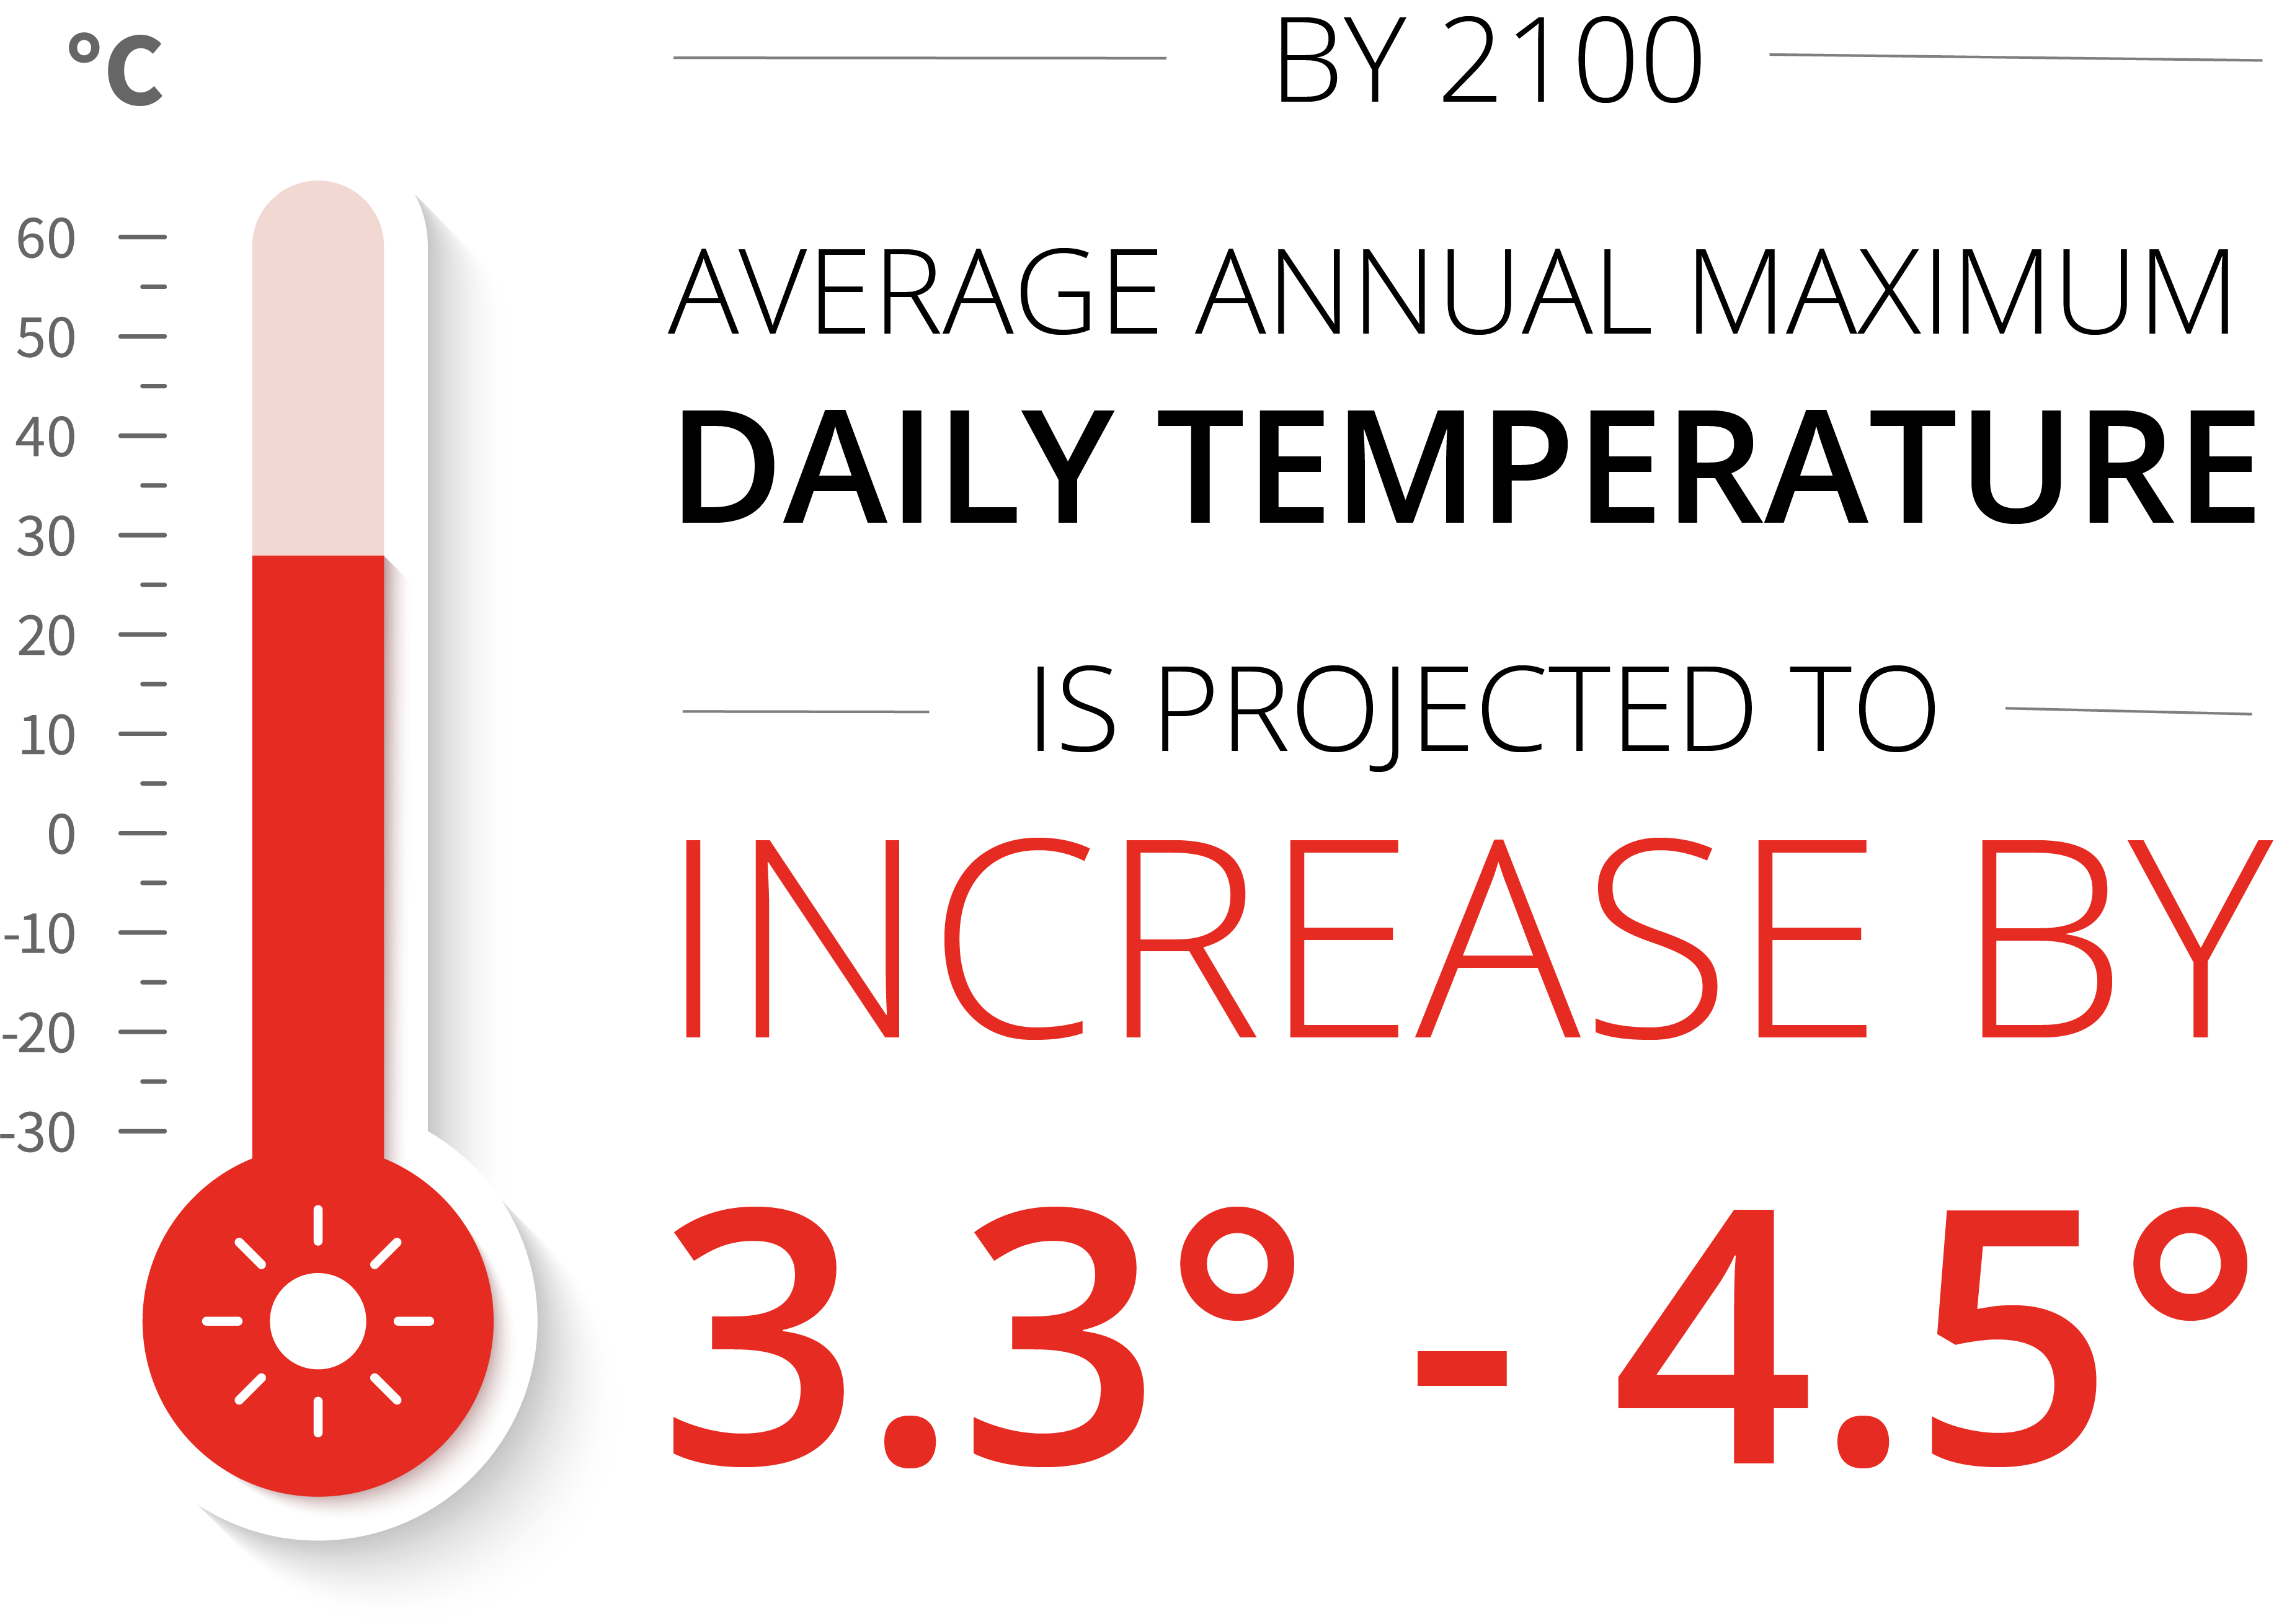
This estimation is a prediction of the California's Climate Change Assessment. The temperature is in Celsius.
More InformationHistoric Climate Change
Every hexagon depicts a bigger city in California.
It
lights
up, if
the mean-temperature is higher in the following year.
This graph should give an insight how often the
temperature was higher in recent years and how severe
the change already is.
You can type in another city to see the temperature
graph or just click on a hexagon.
place
Water Supply from Snowpack


Water management practices in California face growing challenges from continued climate change. Hotter conditions due to climate change could lead to loss of soil moisture and this therefore to more wildfires...
Wildfires in California

By 2100, if greenhouse gas emissions continue to rise, one study found that
the frequency of extreme wildfires
would
increase, and
the average area burned
statewide would increase by 77 percent .
Historic Wildfires
To see the past wildfires, you can highlight with your mouse the time you want to be displayed in the time line below the map. Here you see the perimeters back to 1990 of California wildfires, which were recorded by Cal Fire. Learn more about how climate change is fueling California's recent wildfires with CapRadio's coverage here and here. Here are some more information about the estimates until 2099, which are quite disconcerting: Estimation report (scroll down to page 22 - 26)From 1920-12-12 To 1923-01-19