About the Project
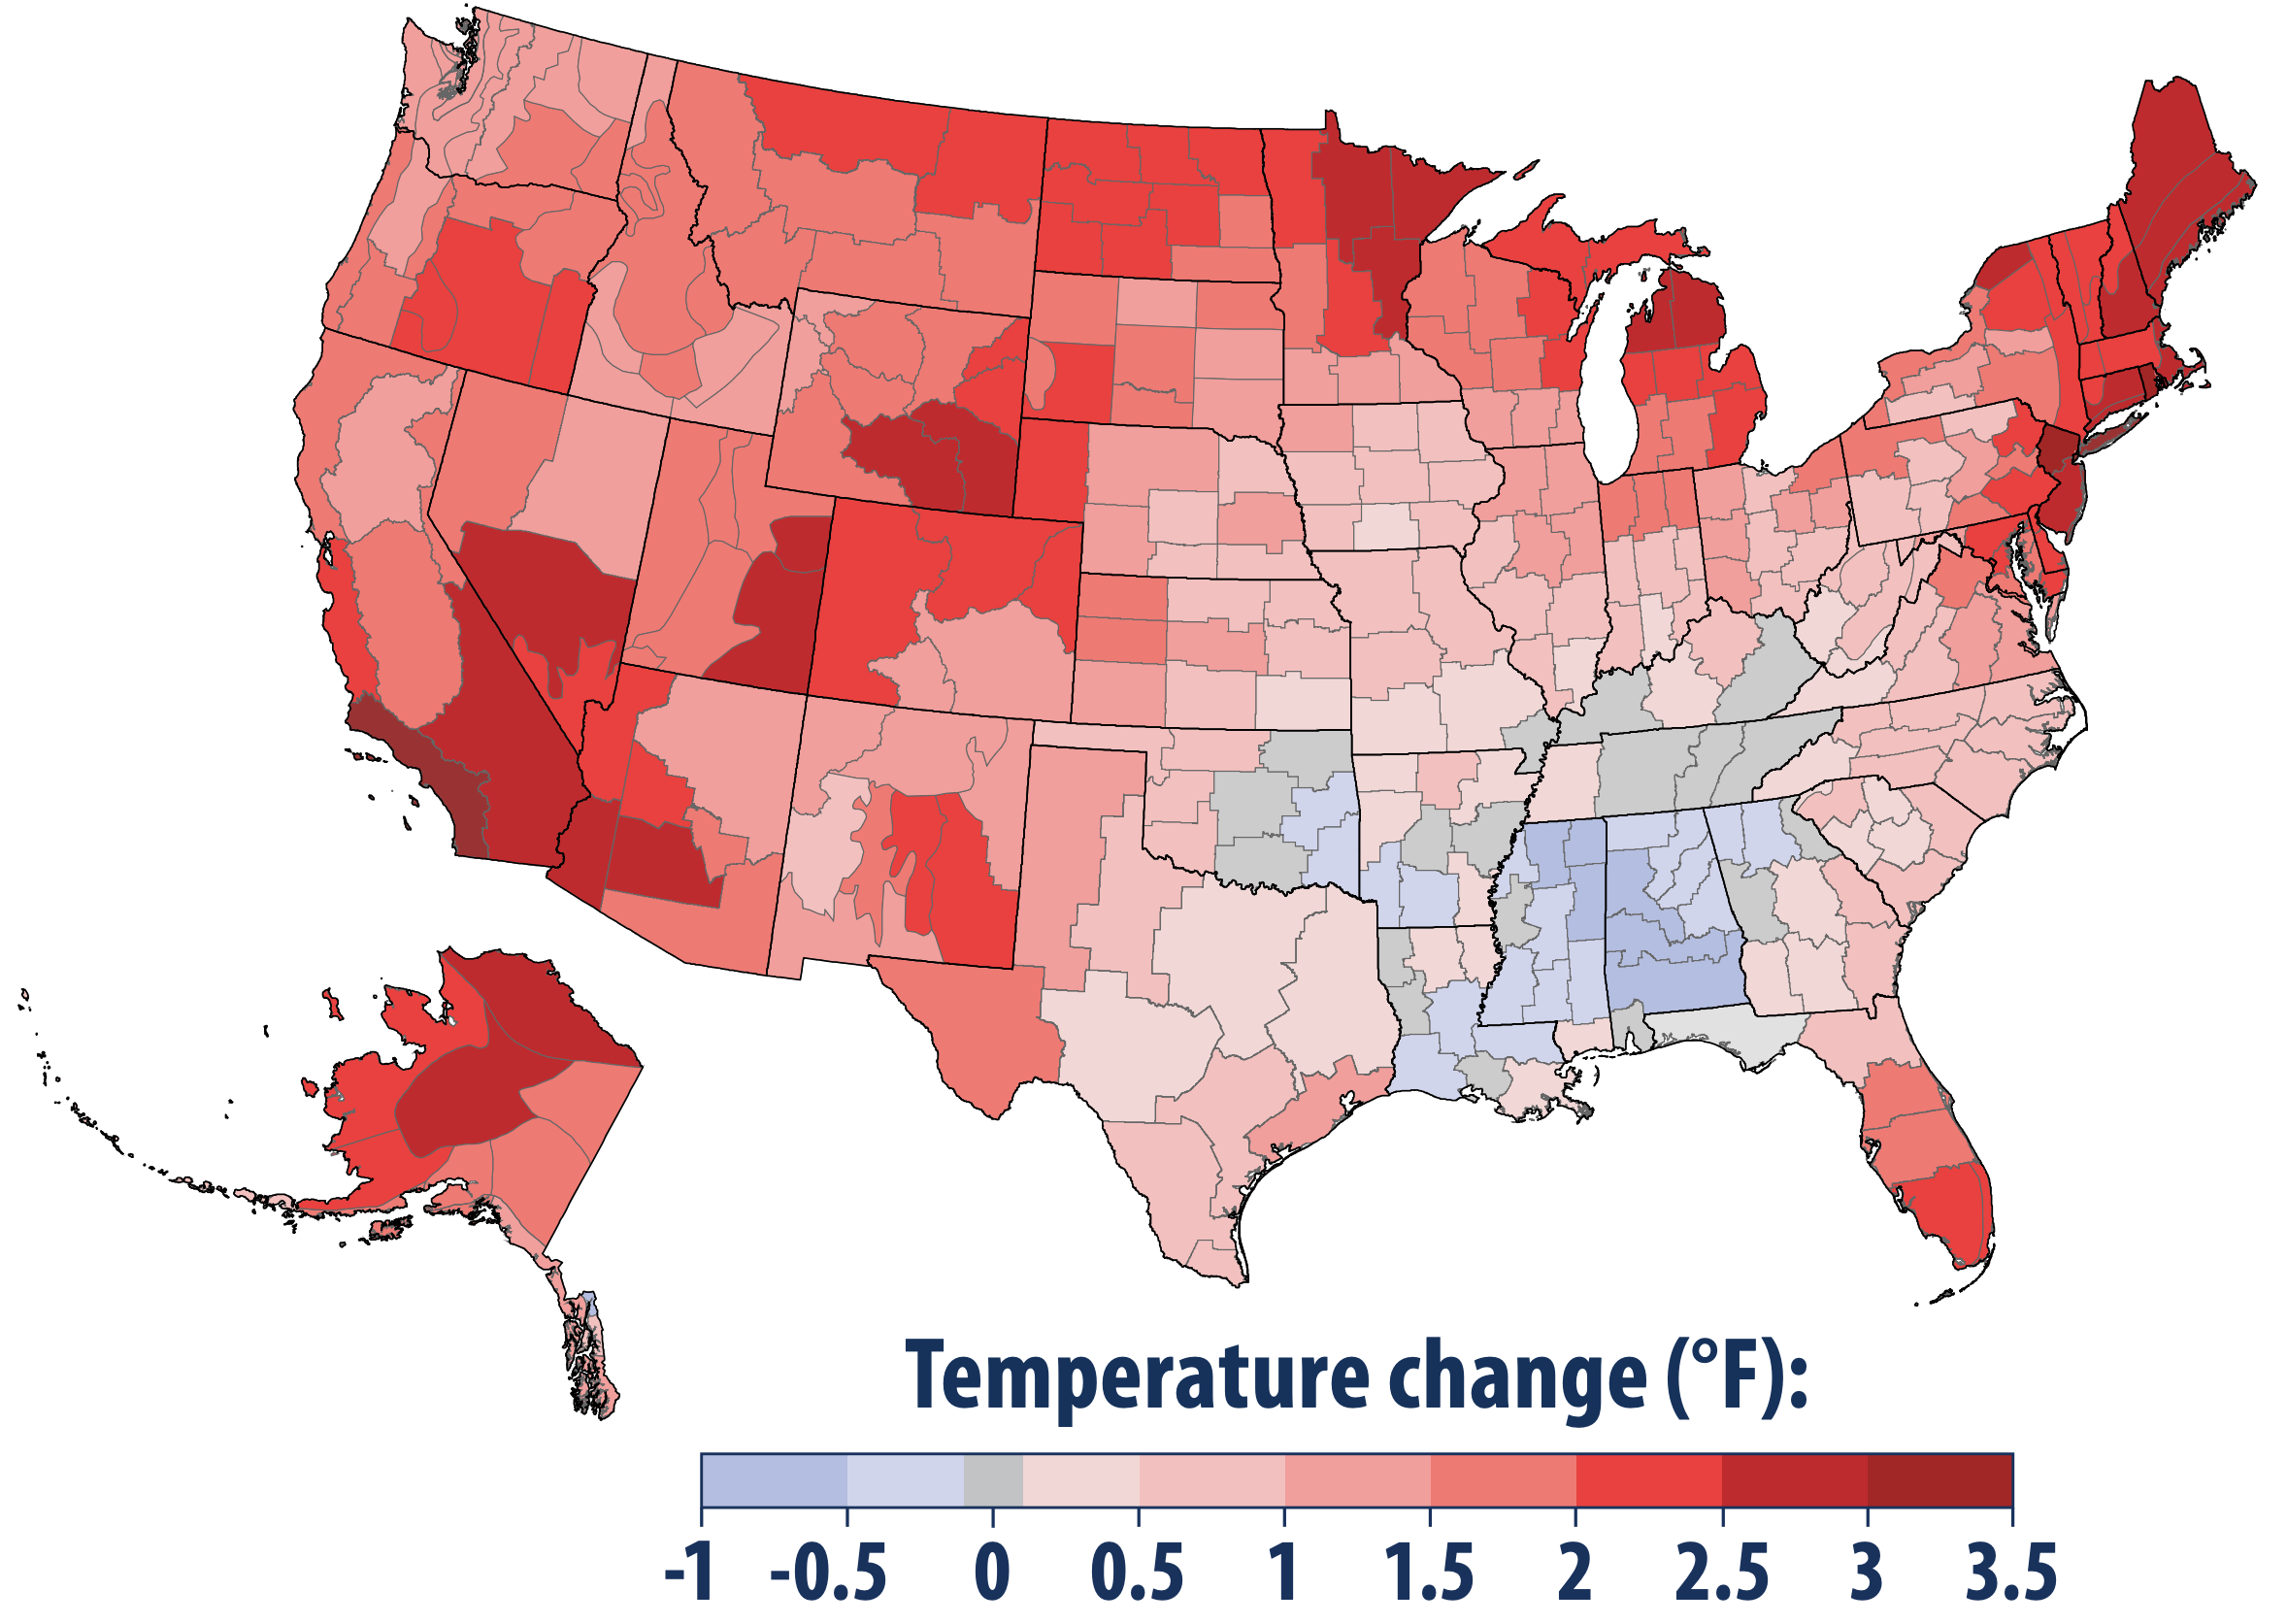
California's climate is changing. Southern California has warmed about three degrees(F) in the last century and all of the state is becoming warmer. Heat waves are becoming more common, snow is melting earlier in spring – and in southern California, less rain is falling as well. In the coming decades, the changing climate is likely to further decrease the supply of water, increase the risk of wildfires, and threaten coastal development and ecosystems.
Wildfires and Changing Landscapes
Higher temperatures and drought are likely to increase the severity,
frequency, and extent of wildfires, which could harm property, livelihoods,
and human health. On average, 4 percent of the land in California has
burned per decade since 1984. In 2003, the Old, Grand Prix, and Padua
wildfires destroyed 800 homes in southern California, forced 100,000
residents to be evacuated, and cost $1.3 billion. Wildfire smoke can reduce
air quality and increase medical visits for chest pains, respiratory problems, and heart problems.
The combination of more fires and drier conditions may expand deserts and
otherwise change parts of California’s landscape. Many plants and animals
living in arid lands are already near the limits of what they
can tolerate. A warmer and drier climate would generally expand the
geographic ranges of the Sonoran, Mojave, and Great Basin deserts. In
some cases, native vegetation may persist and delay or prevent expansion
of the desert. In other cases, fires or livestock grazing may accelerate the
conversion of grassland to desert in response to a changing climate. For
similar reasons, some forests may change to desert or grassland.
The sources of information about climate and the impacts of climate
change in this intro text are:
the national climate
assessments by
the U.S. Global Change Research
"Read full article"
The Project Authors Dedication
Due to this unfortunate developments, this information visualization project is therefore dedicated to visualize the temperature changes as well as the occurrences of wildfires in California. This project shall be an easy accessible visual aid to foster the understanding how global warming is already changing our daily lives. To find out more about how we worked on the project, please find here our detailed "project description".